
Anyone interested in Australian birth rates is aware that the Australian Bureau of Statistics (ABS) publishes birth statistics annually in its ‘Births, Australia’ publication series. The underlying birth data are from birth registrations as reported by each State or Territory.
Births, Australia reports several important national statistics including the total number of births (292,318 in 2024) as well as the overall fertility rate. More detailed fertility statistics are also available disaggregated by various geographical subdivisions, or characteristics of the parents.
The type of statistics provided rarely changes. However, in the latest Births Australia (2024) series a “new” statistic was quietly (re)introduced – the completed cohort fertility rate (CCFR). Unlike the other indicators, which are period measures in a given year, the CCFR is a cohort measure. The CCFR is a an estimate of the average number of children born to a cohort of women.
It has been some time the ABS reported CCFR. the measure was previously recorded in Births, Australia 2002 and 2006 as well as other publications such as Social Trends 2008 and Yearbooks. It’s reintroduction in Births 2024 could point to a growing policy interest in fertility trends. Cohort measures are especially useful to help interpret the underlying patterns in period measures of fertility. Further, the other available measure of cohort fertility asked in past censuses was the question of the number of children ever born, which will not be collected in the 2026 Census. The CCFR may serve as a pseudo replacement until 2031.
Linking CCFR and period trends
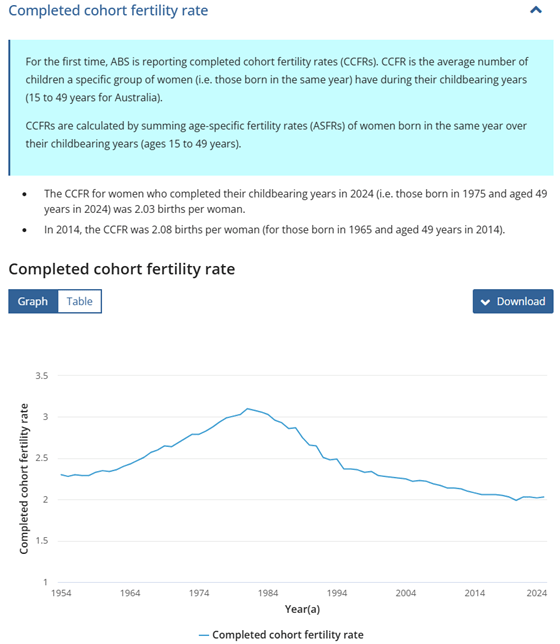
As noted above the CCF is a cohort statistic. All women born in a particular year will share the same CCFR number. And this number is measured or recorded at an age when they have finished having children. This is typically taken to be at some point in the 40s for women, and in the case of the ABS calculations it is age 49 specifically.
For example according to the ABS data, women born around 1905, had on average 2.3 children each. And we can see this in their data and the graph above by looking at the value for 1954 (because women born in 1905 were about 49 years old in 1954). Discussing the CCFR in terms of the year women turned 49 is a bit clunky. If we are just looking at trends it is easier to graph or discuss the statistics in terms of when women were born, i.e. to have their year of birth in the X-axis, rather than the year they turned 49.
If we are interested in seeing how the cohort trends moved contextually and how they relate to ‘period’ trends then typically demographers report the cohort fertility in terms of the relevant year when women were in the midst of their childbearing years, e.g. when their birth cohort turned age 25 or 30.
For example, below the annual TFR is plotted in purple. The trend in CCFR is shown in green, in two different ways. The green dashed line is based on the original ABS graph, and shows the CCFR according to the year women turned 49. The solid green line is the same data but shifted back in time to represent the cohort CCFR according to the year women turned 25. The solid green line matches up quite well with the TFR. We see the unusually high fertility of women who were in their mid 20s during the 1950s and early 1960s (born around late 1920s and 1930s) reflected both in their CCFR as well as in the period rates of the time.
TFR by year, and CCFR by year turned 25 or 49.
The purple line is the Total Fertility Rate (TFR) by year. The green lines are the CCFR presented in two different ways. The dashed line is CCFR plotted against the year a birth cohort turned 49 (as in the original ABS plot) and the solid green line is the same data but plotted according to the year women turned 25 years old.
How is CCFR calculated?
As explained on the ABS website, the CCFR is calculated by taking a specific cohort birth year and summing up the age-specific fertility rates that they would have experienced at every age, from age 15 all the way up to when they turned 49.
Single year of age fertility rates for Australia are readily available on the ABS website so we can calculate this value ourselves easily. As such it is not a ‘new’ fertility measure. It has always been possible to calculate easily using the period fertility rates by age.
Example
Women born in 1960 are estimated to have a completed cohort fertility rate of 2.1698. This is calculated by summing the fertility rates they would have had at every age from when they turned 15 (in 1975) to when they turned 49 (in 2009).
In 1975 when they were 15, their fertility rate was 7 births per 1,000 women. In 1976 when they were 16 it was 15.9, when they were 17 it was 30 births per 1,000 women and so on.
CCFR 1960 cohort= 7+15.9+30+43.7+57.1+…….,0.3=2.1698
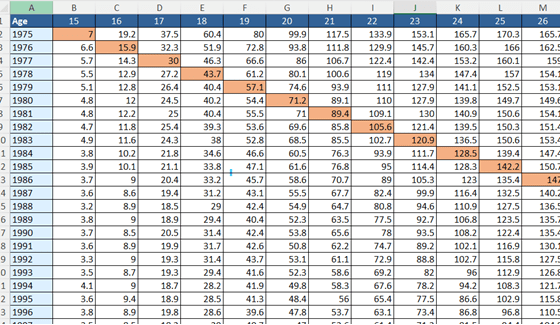
This way of calculating CCFRs is not the most precise because, for women born in 1960 they were not all aged 15 throughout all of 1975! Women born in November 1960 for example would have been aged 14 throughout most of 1975. There are more precise ways to calculate CCFR which distinguish birth cohorts precisely, but for most cases this rough approximation works.
Assumptions and alternative estimates of completed fertility
When the CCFR is calculated from period vital registration data as in the example above the clear assumption being made is that the cohorts of women are in the population and experiencing these fertility rates at every age from 15 to 49. In other words, they are not subject to mortality or migration. They are present and giving birth in Australia. In reality of course, immigration and emigration will add or remove women at different ages so that only partial fertility histories are captured from them.
Other ways of looking at cohort completed fertility, for example using survey or census data can give us different numbers.
As mentioned, in the Census, women are asked how many children they have ever had. If we focus on women who are old enough to have mostly finished childbearing (e.g. women aged in their mid to late 40s) and see their answers to this question we can calculate their cohort fertility, assuming no major effect of mortality or migration. The data can be grouped by cohorts of women born at the same time.
In the graph below, the black line plots the original CCFR estimates from the Births 2024 report which are based on the period fertility rates summed up diagonally. We then compare this with the calculated average number of children born by women’s year of birth, as reported in Censuses from 2006 to 2021. For the Census calculations we used 5-year age/birth cohorts, and plotted these at the midpoint of the cohort. For example, the number of 2.19 shown for 1954 in the 2011 Census refers to women born in 1952-1956. Similarly for the Census points at 1974 this refers to the average number of children for women born 1972-1976.
In the Census not all women answer the question, and some may choose not to respond for a variety of reasons, including if they don’t have children and don’t feel that question applies to them. For that reason the Census statistics were calculated using the El-Badry correction which helps correct this problem.
As we can see the trends from the Census data and the period fertility data follow the same trajectory overall. However, the estimates from the Census data are slightly lower. There could be a number of reasons for this discrepancy including under-reporting of births in the Census, and the effect of past migration patterns.
While the CCFR is not a new measure for the ABS, it can be readily calculated using available data. Its reintroduction in the Births Australia reports is a welcome addition as understanding fertility trends requires taking both a period and cohort perspective and moving beyond a reliance only on period indicators such as the TFR. Unfortunately the CCFR itself is limited in many ways.
Cohort fertility trends by parity
One limitation of the CCFR is that it is an average measure. It tells us nothing about the parity distribution, or the distribution of women according to the number of children they have. A CCFR of 2 children for example can come from 100% of women having 2 children; 50% of women having 4 children and 50% having no children, or from something in between. Many countries have the same CCFR values but the underlying distribution by parity is very different, and this has important social implications and also can tell us a lot about how childbearing takes place in a society. In Australia information regarding parity primarily comes from the Census.
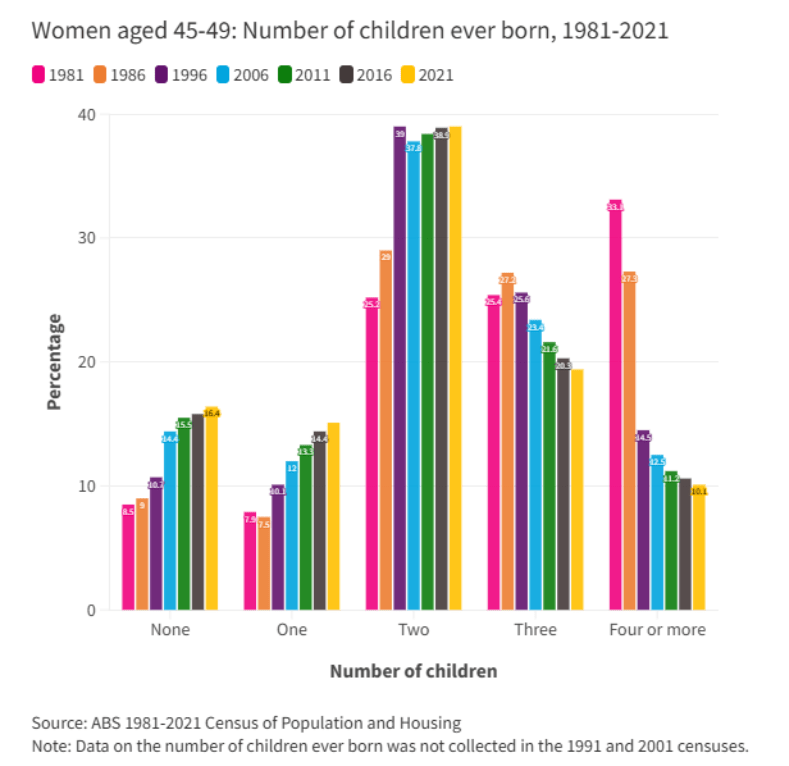
Source: Births in Australia | Australian Institute of Family Studies
Cohort fertility trends across society
Fertility trends vary widely across society. A person’s ethnic background, education and labour market experience have a huge influence on how many children they have. To understand fertility trends it is therefore vital to understand how childbearing rates vary across society and how these variations themselves change over time.
While the readily available period fertility rates can be used to calculate cohort fertility measures such as the CCFR by summing the fertility rates of women at sequential ages ‘diagonally’, these fertility rate cannot be broken down by other characteristics. To get the deeper insight needed for understanding modern fertility trends in Australia it is necessary to also understand cohort fertility trends by different characteristics, for example education. While some surveys can be useful for this type of analysis, the Census has been the primary source of data for this type of valuable research.
Report prepared by Anna Reimondos, February 2026