
A look behind a statistic: How many young people live at home in Australia?
In this post, we unpack three reasons why estimates of living at home differ: how ‘young people’ are defined, how ‘living with parents’ is measured, and who is counted in the population. These distinctions explain why numbers vary so widely across sources.
Some demographic statistics are complex to calculate. Life expectancy at birth and the total fertility rate are two examples where calculations involve a number of steps and assumptions. Other statistics look simple on the surface. But even seemingly straightforward statistics can hide a more complex reality.
In this post, we look at the percentage of young people who live with their parents in Australia; a figure that often piques the interest of the public and policymakers whenever it is reported. Changes across generations in this percentage may reflect shifting social norms, but also differences in the structural and economic constraints that younger generations face in moving out of their parental home and living independently.
For a few different reasons, it is a surprisingly hard statistic to pin down, with different estimates in Australia varying quite significantly, making it difficult to see patterns clearly over time. In this post, we will outline what the numbers say about the proportion of young people who live with their parents and explain why we often see quite a lot of variation across data collections. By the end, we hope that next time you see a headline referring to the percentage of young people living at home, you’ll know how the source of the data, and the definitions used affected the estimate.
A simple percentage
The calculation itself is easy. As with any percentage, we divide the population of interest by the total population and multiply by 100. The population of interest in this case is young people living at home.
=Young people living at homeAll young people in the population∗100
The complexity of statistic doesn’t lie in the formula but rather in how we define and measure the three elements that go into it: 1) young people, 2) living at home, and 3) the total population.
Challenge 1: Who are young people?
The first challenge encountered when examining the statistics on the percentage of young people living at home is that there is no standard definition of ‘young people’. Different sources tend to employ quite markedly different age groupings including: 15-24 years old; 18-24 years old, 18-34, 20-29 and so on. In addition, sometimes the numbers are disaggregated by gender, and other times the estimates are reported for both genders combined. When data are reported in different age groups like this it can make it very difficult to compare figures and spot patterns or trends.
The following is a list of recent estimates of the percentage of young people living with their parents in Australia in 2021:
- 42% of those aged 20-29 (OECD 2026).
- 43% of women and 51% of men aged 20-24 (AIFS 2023).
- 69% of 15-24 year-olds (AHURI 2023).
- 9.9% of 25-39 year olds (ABS 2022).
Another recent estimate, from 2017, found that 56% of men and 54% of women aged 18-29 lived with one or both of their parents (Wilkins & Vera-Toscano 2019).
For statistics which don’t vary much over age, the use of different age groups doesn’t matter much. However the percentage of people living at home changes sharply from one age to the next, so the age group chosen makes a big difference. The graph below shows the percentage of people living at home based on two data sources, the 2021 Census, and a large scale annual social survey in Australia known as the Household Income and Labour Dynamics in Australia (HILDA) data. There are some differences in the two lines, which we will discuss further, but for now the main thing to focus on is the shape over age. They both have a similar ski-slope shape with a slow decline up to around age 17 in the Census, and age 19 in HILDA, followed by a more dramatic slope down afterwards. From then, the percentage of young people living with their parents drops sharply with each subsequent birthday. This steep decline means that even small shifts in the age boundaries (e.g., 20–24 vs 18–29) can dramatically change the headline figure. If we took an age group such as 15-29 this would cover a huge range of ages and different experiences. Smaller 5-year intervals such as 20-24 are more appropriate, although they too can obscure trends.

The graph also shows that HILDA and Census estimates diverge. For example, HILDA estimates 69% of people aged 21 are living with their parents, while the Census estimates just 53% of 21-year-olds are living with parents. This is not a unique occurrence as Census estimates tend to be lower than estimates from other surveys. For example, the Longitudinal Surveys of Australian Youth (LSAY) put the same figure, for 21-year-olds in 2021, at 68% (NCVER 2024). Below, we look at two reasons estimates can differ so substantially across sources. The first has to do with differences in who is measured in the numerator.
Challenge 2: Children living with parents…or parents living with children?
The second complication with calculating the percentage of young people living at home, and one of the reasons why estimates can differ substantially, is who is counted as ‘living with parents’. Narrower definitions will capture fewer people and produce lower percentage estimates.
Typically, information about living with parents comes from surveys, but rarely does it come from a direct question that asks ‘do you live with your parents?’ or ‘do you live at home?’ Instead, it is usually derived from background household data about who lives in a household, and how household members relate to each other. Depending on how the data were collected the level of detail about the relationships between household members may differ.
Take a hypothetical example: a 24-year old woman who is living with her partner, her own child, as well as her mother. She has several simultaneous relationships with different household members: she is a partner, a mother, and a daughter. If she was part of the HILDA survey we would easily be able to identify that she is living with her parent, as HILDA collects information about how every household member relates to every other member. However, in the data made available from the Census we would not be able to see the parental co-residence. That’s because the Census only records how each person relates to a single reference person, and assigns each person one classification according to a specific set of rules set out in the Family, Household and Income Unit Variables Standards.
In the case of our hypothetical example, she would be coded as a ‘partner’ and her mother would be coded as ‘other related individual’. For young persons, the most common situations in which this coding method will lead to ‘missed’ parents is if they are living with a partner or if they are a lone parent (and living with a parent).
In short, the Census tends to undercount parent–child co‑residence when young adults have formed their own family units, whereas surveys like HILDA capture these relationships more fully.
The share of young people living with parents who would not be picked up as such by the ABS classification approach is relatively small in general. For example, comparing the ABS’s classification approach against a more direct measure of living with a parent (both applied within HILDA) gives a modest difference: 58% versus 60% based on enumerated persons aged 20-24 in Wave 23 (2023). In the 2023 data, around 9% of 20-24 year olds classified as living in a couple relationship and around 15% of lone parents, are also living with at least one parent.
It is also worth noting a couple of more conceptual issues here as well. As with any analysis it is important to be clear about what we are actually trying to measure. Throughout the blog post we have used the terms ‘living with parents’ interchangeably with ‘living at home’. That is often the implicit connection that is made when we talk about these two concepts as we are imagining and wanting to capture the numbers of young people who are still living in their parental home.
However, what we are measuring is co-residence with a parent. An adult child co-residing with a parent could also reflect a situation where the adult child is the main householder and their parent has moved in with them. We don’t know if the young person is living in the parent’s home, or if the parent has moved into the young person’s home, for instance to receive or provide care. Along similar lines, if the goal is to measure young people who are not living independently, it may also be worth including other types of relationships, for example young persons living with grandparents, to capture young people who have been raised by grandparents.
Challenge 3: Private and non-private dwellings
Another reason why the different estimates reported above vary is who is counted overall. Most general social surveys, including HILDA, only sample people who live in private dwellings. This is different from the Census, which counts people regardless of whether they are in private or non-private dwellings.
Of course, most people live in private dwellings, for example houses, apartments, or similar. But at any point in time, some of the population lives in non-private dwellings such as hospitals, prisons, student accommodation, religious institutions, hotels, or defence establishments (ABS 2021). The non-private dwelling population is small overall, but its size varies across the life course. There are particular ages or parts of the life course when living in a non-private dwelling is more likely. At the young ages, the peak age for living in non-private dwellings is around age 18-20. In the 2021 Census, around 6% of 19-year-olds were enumerated in non-private dwellings, mostly in residential colleges or halls of residence (ABS 2026a).
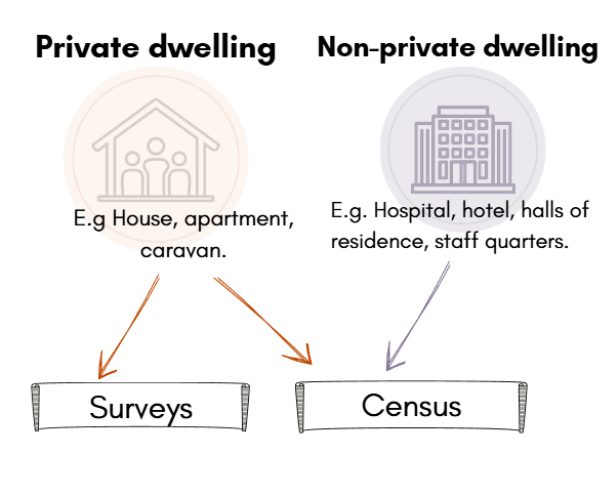
As seen in earlier figure, if we only look at private dwellings then the proportion of young people living with their parents will naturally appear higher than if we look at all young people including those not in private dwellings.
If we take the Census data and calculate the percentage of 20-24 year olds living with their parents based on the total numbers, we get an estimate of 46%. However, if we exclude from our calculations individuals who were classified as ‘visitors’ to the household on the day the Census was taken, the figure increases slightly to 47%. If we go a step further and subtract from our calculation young people aged 20-24 who arrived between 2019 and 2021 (i.e. up to 3 years before the Census), in an effort to exclude some of the potential students and working holiday makers who are being included, this leads to a jump of the estimate to 49% of 20-24 year olds living with their parents. Finally, if we focus in on only private dwellings, similar to surveys, we get an estimate of 51%. By refining who we include in the calculations, and making the criteria for inclusion more similar to what we might see in a survey, we get a higher estimate.

So how many young people live at home in Australia?
So how many young people do live at home in Australia? The answer is – it depends. It depends on how we classify ‘young person’ and what source of data we use.
For simplicity we use the age group 20-24. The figure below shows the percentage of 20-24 across several different data collections including the Census and several other surveys. This shows more clearly the degree of variation in estimates across sources, even for a consistent age group. The variation comes partly from who is included in each survey’s sampling frame, and partly from who chooses to take part. The ‘true’ estimate is likely to be slightly lower than the survey estimates, since they exclude non-private households, but somewhat higher than the Census which includes many overseas born students etc but also doesn’t fully capture living with parents in its relationship in household classification.
Despite the variation across the data source, we can see that the percentage of 20-24 year olds living at home appears to be trending upwards. It will be very interesting to see what the 2026 Census will reveal.

How does Australia compare internationally?
How does Australia compare with other countries? It is difficult to know because of the previously discussed issues with inconsistent age groups and definitions of ‘living at home’. However, there are some comparative statistics available. The OECD (2026) maintains a database of information on housing, including on living arrangements of young people aged 20-29. However, as discussed earlier this is a wide age range and the figure for Australia, while based on HILDA data, underestimates the percentage living with parents. This is because the information covers not just living with parents, but also other household living arrangements including lone parenthood, and as with the Census children who are living with parents but also lone parents or will often be classified as such instead.
We can quickly look at some other sources though, for a brief comparison. For England and Wales, data from their 2021 Census suggests 51% of 20-24 year olds were living with their parents, while in Ireland the comparative figure was 61% in 2022, and in Canada 57% for 2021 (England and Wales data from Office of National Statistics 2023; Ireland figure from Central Statistics Office 2023 and Canada data from Galbraith & Laflamme 2025).
So, the exact number will always depend on how we slice the data. Taken together, these three challenges- age definitions, relationship coding, and dwelling type, explain why estimates diverge. These nuances matter because they shape how we interpret trends and inform decisions about youth and housing. Rather than searching for a single “correct” number, it can often be more meaningful to track trends over time within consistent data sources.
References
Australian Bureau of Statistics. (2021). Variables by topic. ABS. https://www.abs.gov.au/census/guide-census-data/census-dictionary/2021/variables-topic
Australian Bureau of Statistics. (2022). “Back in my day” – comparing Millennials with earlier generations. Australian Bureau of Statistics. https://www.abs.gov.au/articles/back-my-day-comparing-millennials-earlier-generations Accessed 30 July 2026
Australian Bureau of Statistics (2026a). AGEP Age by RLHP Relationship in Household – 2021 Census – counting persons, place of usual residence [Census TableBuilder], Accessed 30 July 2026
Australian Bureau of Statistics (2026b). AGE5P Age in Five Year Groups by RLNP Residential Status in a Non-Private Dwelling by RLHP Relationship in Household by CITP Australian Citizenship and YARP Year of Arrival in Australia 2021 Census – counting persons, place of usual residence [Census TableBuilder], Accessed 30 July 2026
Australian Housing and Urban Research Institute [AHURI] 2023. What are the real costs of the housing crisis for Australia’s young people? https://www.ahuri.edu.au/analysis/brief/what-are-real-costs-housing-crisis-australias-young-people Accessed 30 July 2026
Australian Institute for Family Studies [AIFS] (2023) Young People living with their parents https://aifs.gov.au/all-research/facts-and-figures/young-people-living-parents Accessed 30 July 2026
Central Statistics Office (2023). Census of Population 2022 Profile 3 – Households, Families and Childcare. Adults Living with Their Parents https://www.cso.ie/en/releasesandpublications/ep/p-cpp3/censusofpopulation2022profile3-householdsfamiliesandchildcare/adultslivingwiththeirparents/ Accessed 20 August 2026
Galbraith, N. and N. Laflamme (2025). Adulting together: Parents and adult children who co-reside. Catalogue no. 91F0015M. Statistics Canada. https://www150.statcan.gc.ca/n1/pub/91f0015m/91f0015m2025002-eng.htm Accessed 20 August 2026
NCVER (2024) Longitudinal Surveys of Australian Youth, LSAY QuickStats Y15 (Living Arrangements 7/2021- Living With Parents] https://www.lsay.edu.au/ Accessed 20 August 2026
OECD (2026). OECD Affordable Housing Database , Table HM1.4 Living arrangements by age group. https://www.oecd.org/en/data/datasets/oecd-affordable-housing-database.html Accessed 30 July 2026
Office of National Statistics [ONS] (2023). More adults living with their parents. https://www.ons.gov.uk/peoplepopulationandcommunity/populationandmigration/populationestimates/articles/moreadultslivingwiththeirparents/2023-05-10 Accessed 20 August 2026
McDonald, P., Jones, FL., Mitchell, DA., Baxter, J (2019). Negotiating the Life Course, 1997, V2 https://doi.org/10.26193/JO4EFL, ADA Dataverse https://dataverse.ada.edu.au/dataverse/negotiating-the-life-course
Wilkins, R., & Vera-Toscano, E. (2019) Over 50% of young Australian adults still live with their parents – and the numbers are climbing faster for women. The Conversation, 30 July. https://theconversation.com/over-50-of-young-australian-adults-still-live-with-their-parents-and-the-numbers-are-climbing-faster-for-women-120587 Accessed 30 July 2026